Zabbix Monitoring
Self-hosted monitoring for my lab and hosted services with tuned triggers, dashboards, and notifications.
Self-hosted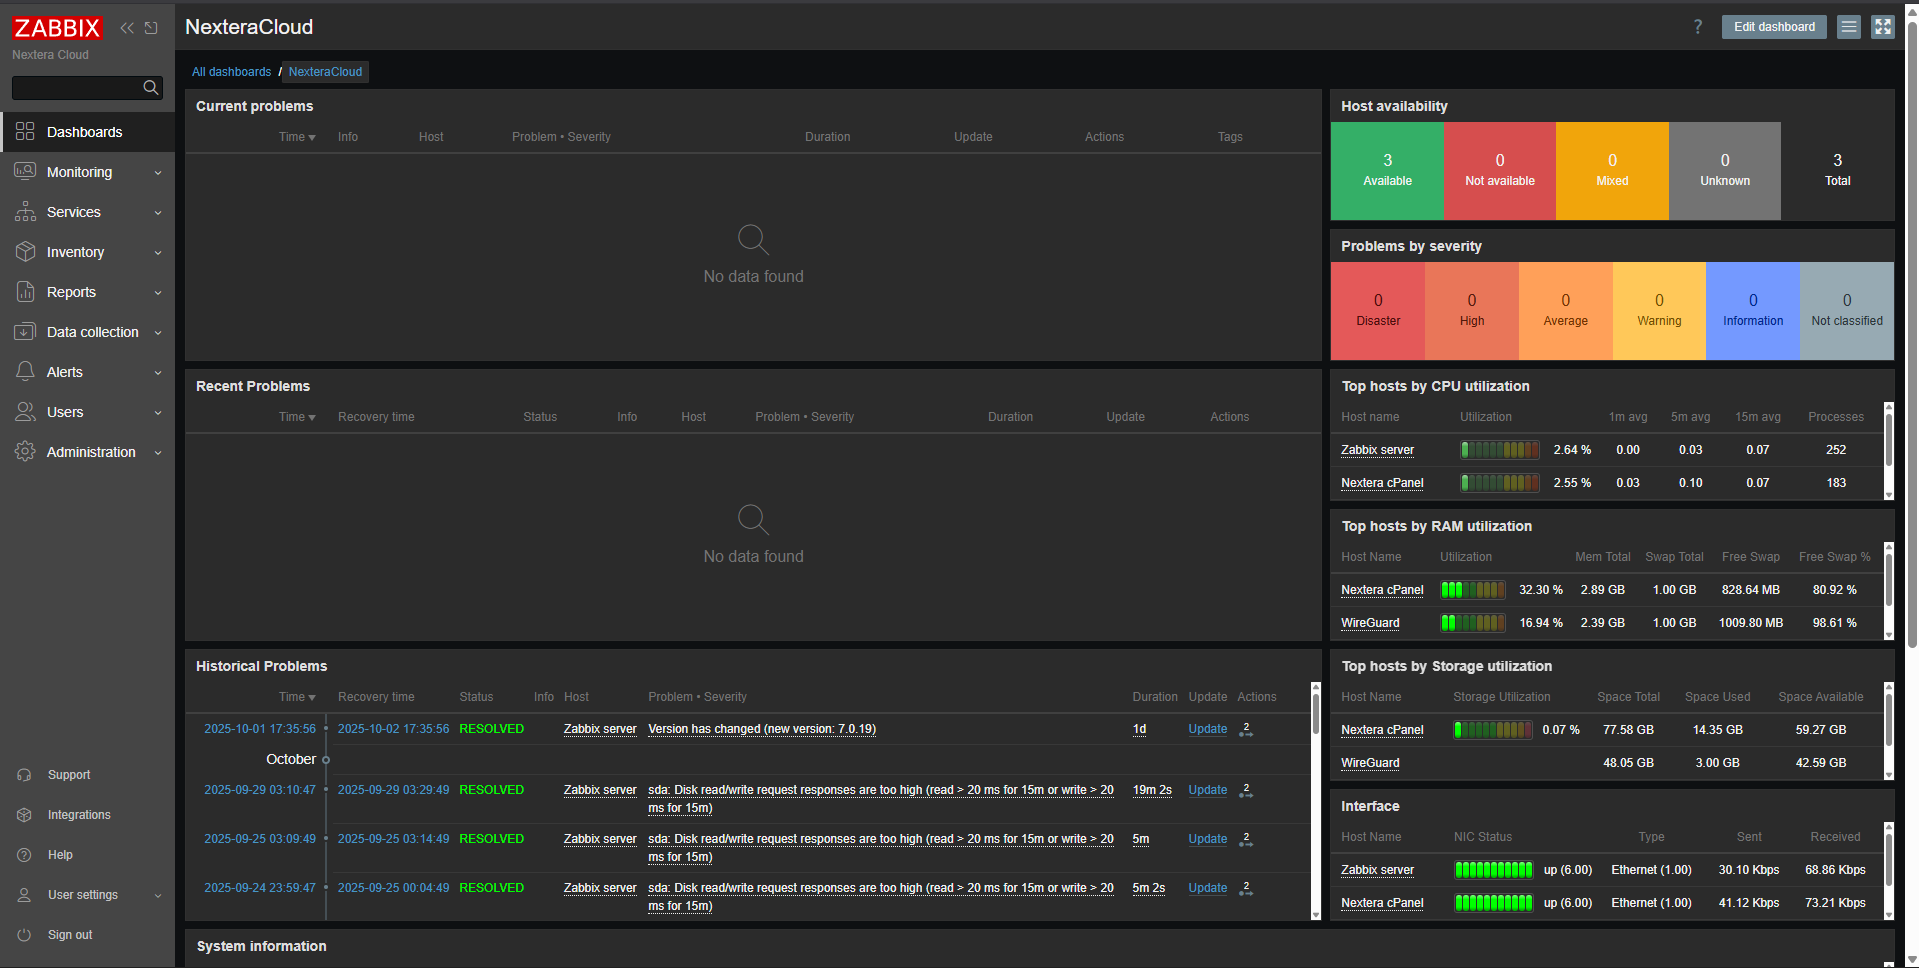
What I run
- Zabbix server on Linux; agents on key hosts (agent2 where useful).
- Dashboards for CPU/RAM/storage, service health and quick triage.
- Alerting tuned to reduce noise: actionable thresholds & maintenance windows.
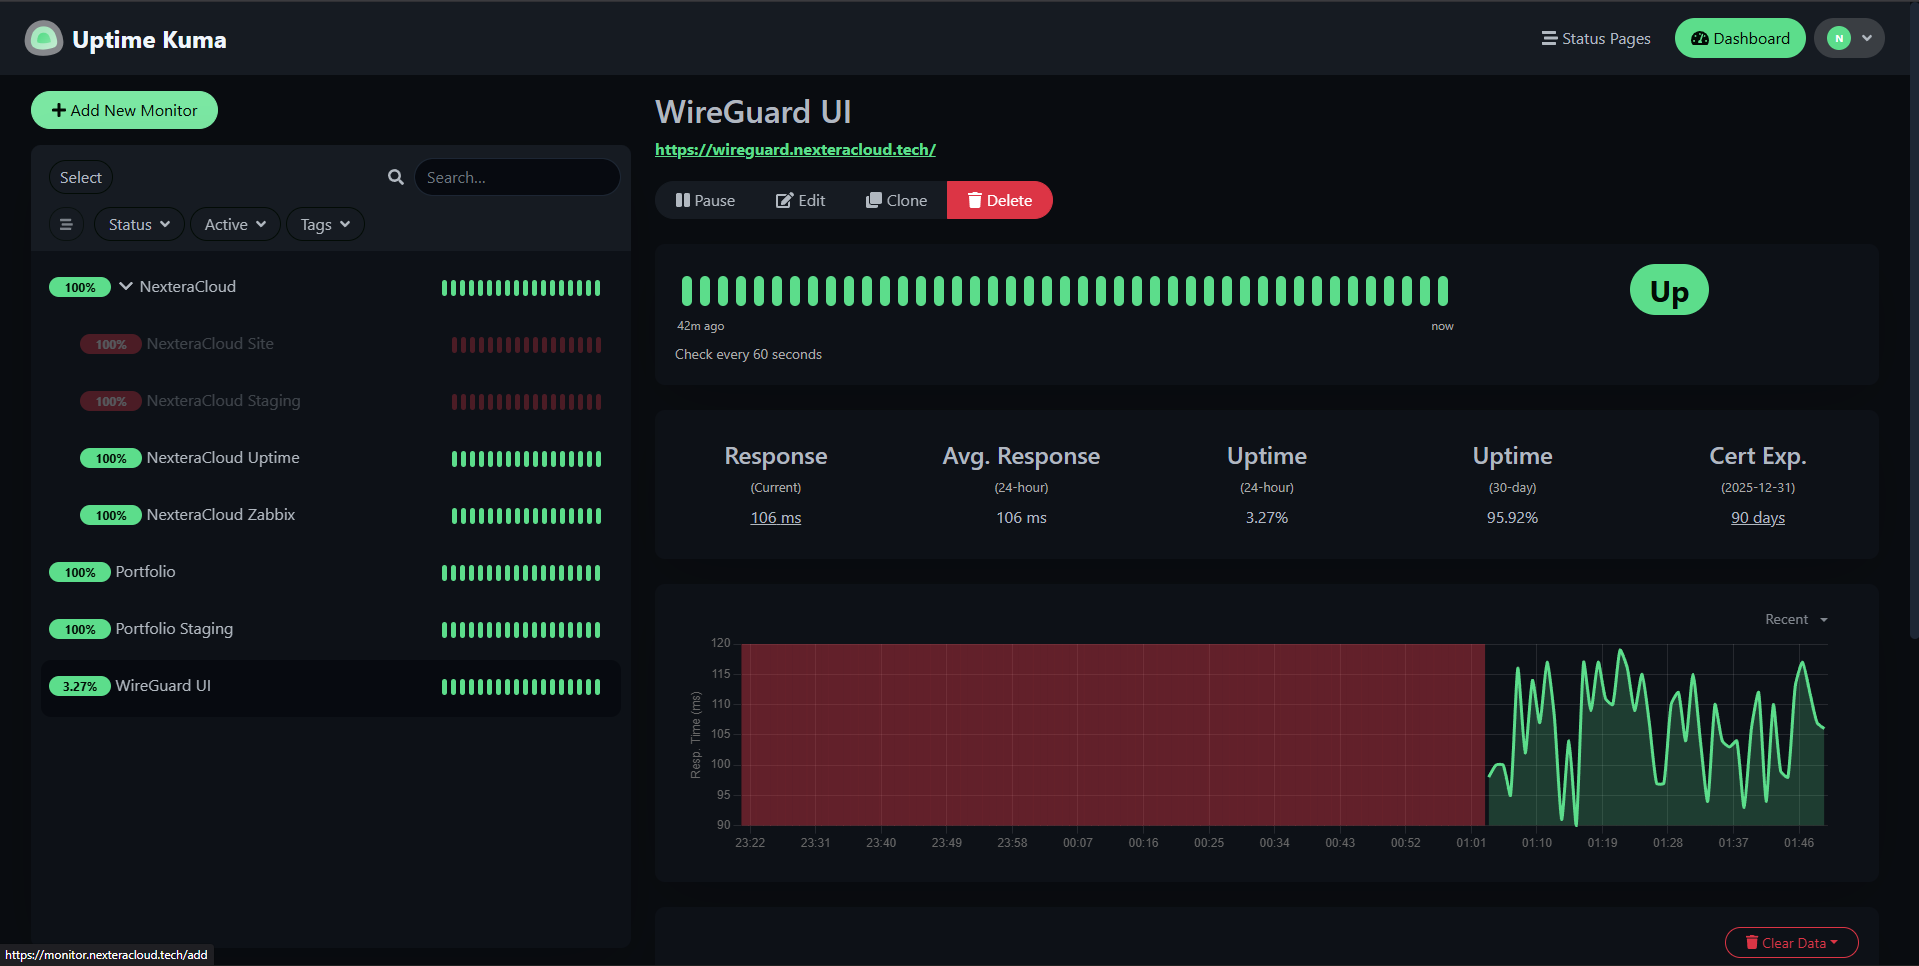
- External uptime via Uptime Kuma for public-facing perspective.
Snippets
Install Zabbix agent on Rocky/EL (example):
# Zabbix 7.0 repo (example; adjust for your version)
rpm -Uvh https://repo.zabbix.com/zabbix/7.0/rhel/9/x86_64/zabbix-release-7.0-2.el9.noarch.rpm
dnf clean all
dnf install -y zabbix-agent

# Point agent to your server and start
sed -i 's/^Server=.*/Server=10.0.0.5/' /etc/zabbix/zabbix_agentd.conf
sed -i 's/^ServerActive=.*/ServerActive=10.0.0.5/' /etc/zabbix/zabbix_agentd.conf
systemctl enable --now zabbix-agent
API example: create host & link a template:
curl -s -X POST http://zabbix.local/api_jsonrpc.php \
 -H 'Content-Type: application/json' \
 -d '{
  "jsonrpc":"2.0","method":"host.create",
  "params":{
    "host":"nextera-cpanel",
    "interfaces":[{"type":1,"main":1,"useip":1,"ip":"10.0.0.10","dns":"","port":"10050"}],
    "groups":[{"groupid":"2"}],
    "templates":[{"templateid":"10001"}]
  },
  "auth":"<TOKEN>","id":1
}'
I keep notes on thresholds and noise-reduction so alerts stay useful.