Uptime Kuma
Outside-in monitoring for websites and services with response time graphs and status pages.
Self-hosted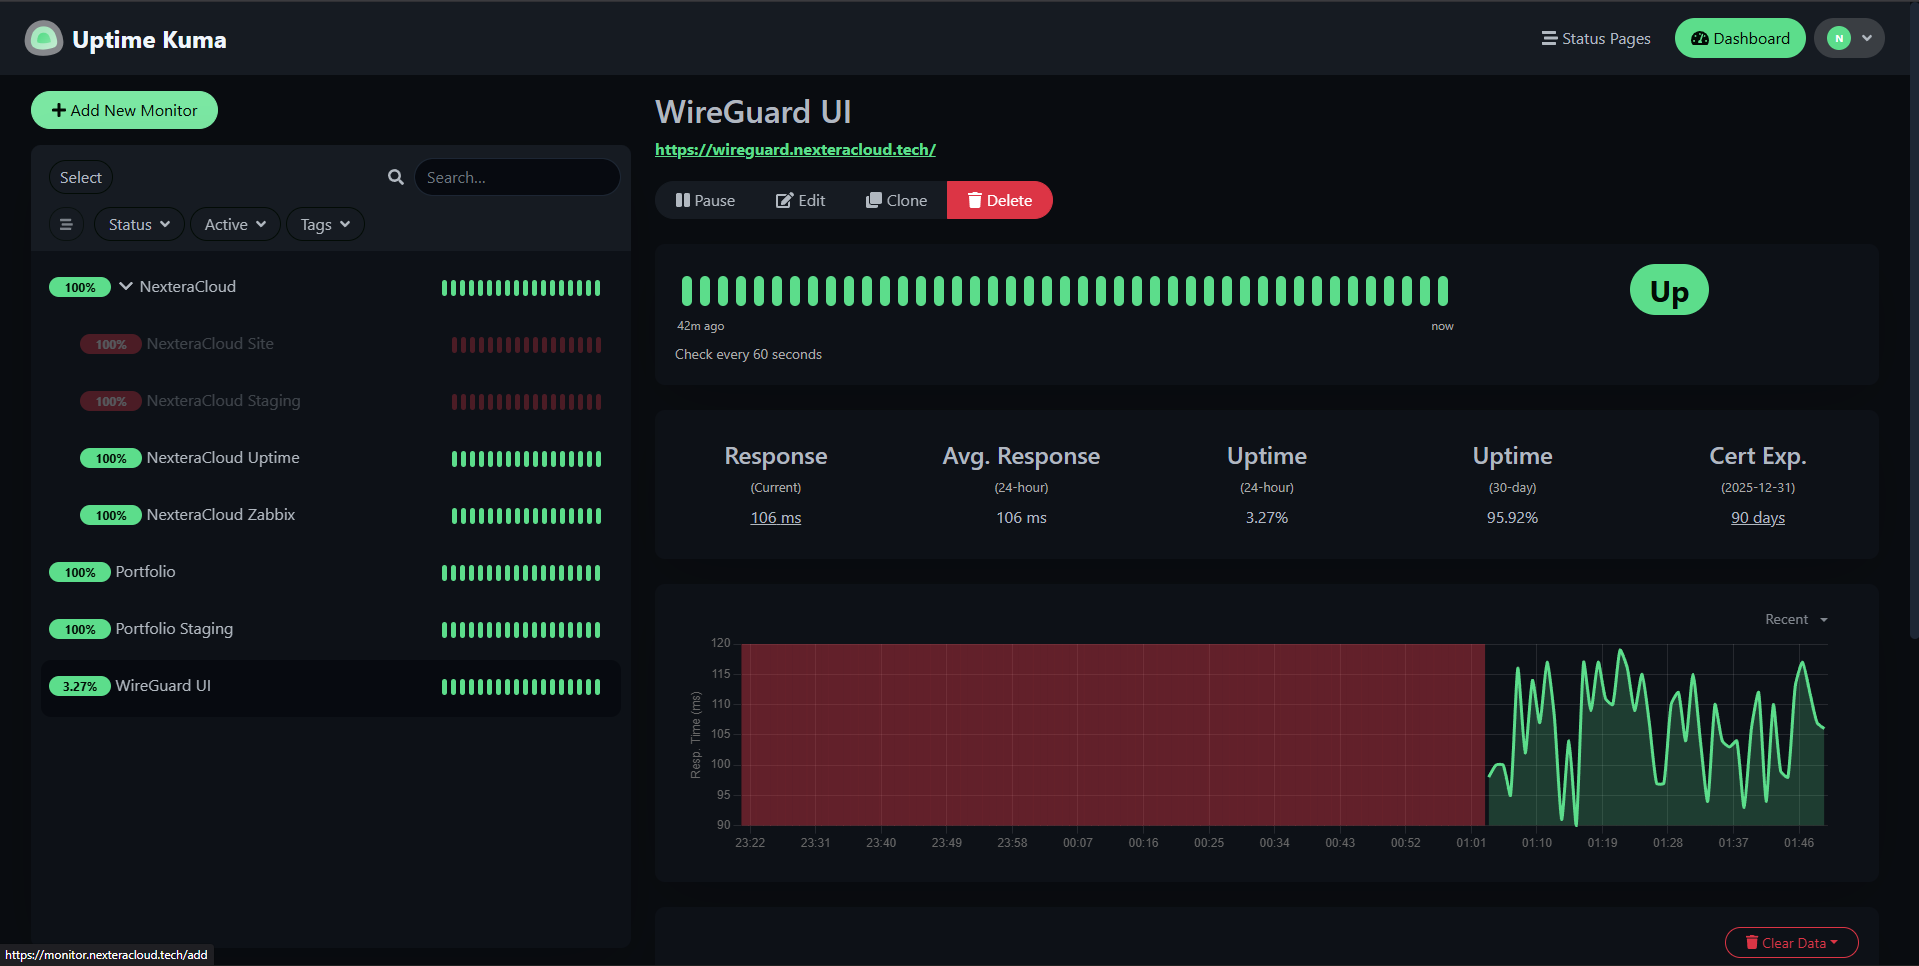
What I run
- Containerised Uptime Kuma behind HTTPS with periodic backups.
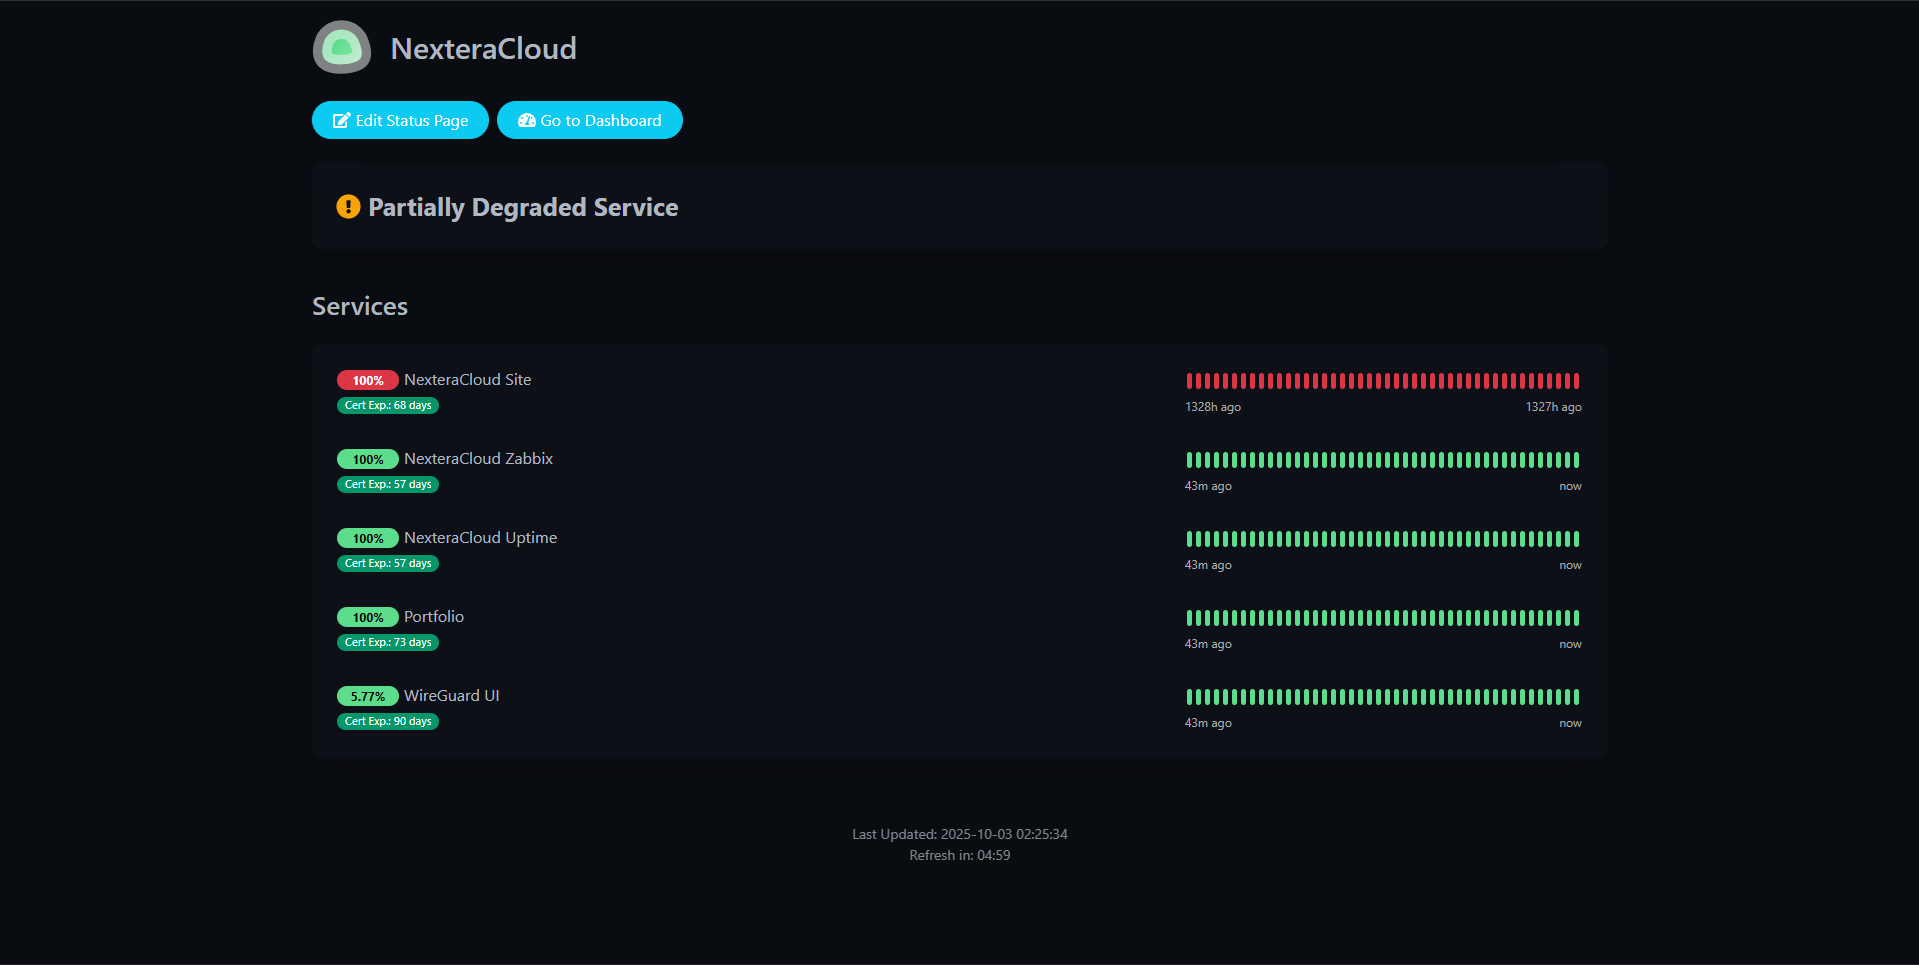
- Monitors for public endpoints (Portfolio, Staging, WireGuard UI, Zabbix, etc.).
- Notifications tuned to avoid noise (grouping + minimum interval).
- Status page for quick “are we up?” visibility.
Snippets
docker-compose example:
version: "3.8"
services:
  uptime-kuma:
    image: louislam/uptime-kuma:1
    container_name: uptime-kuma
    restart: unless-stopped
    ports:
      - "3001:3001"
    volumes:
      - /opt/uptime-kuma:/app/data
    environment:
      - TZ=Europe/London
Add a simple HTTP monitor (web UI):
New Monitor → Type: HTTP(s)
Name: Portfolio
URL: https://matthodges.uk/
Method: GET
Heartbeat Interval: 60s
Max Retries: 2
Notification: <your channel>
I keep Kuma for the outside view and Zabbix for deep metrics/alerts—together they cover most failure modes.